
Store Dashboard
Summary: You will use the Store Dashboard to see where and how crime incidents are occurring, and optionally ask questions of the Store Analytics Lens.
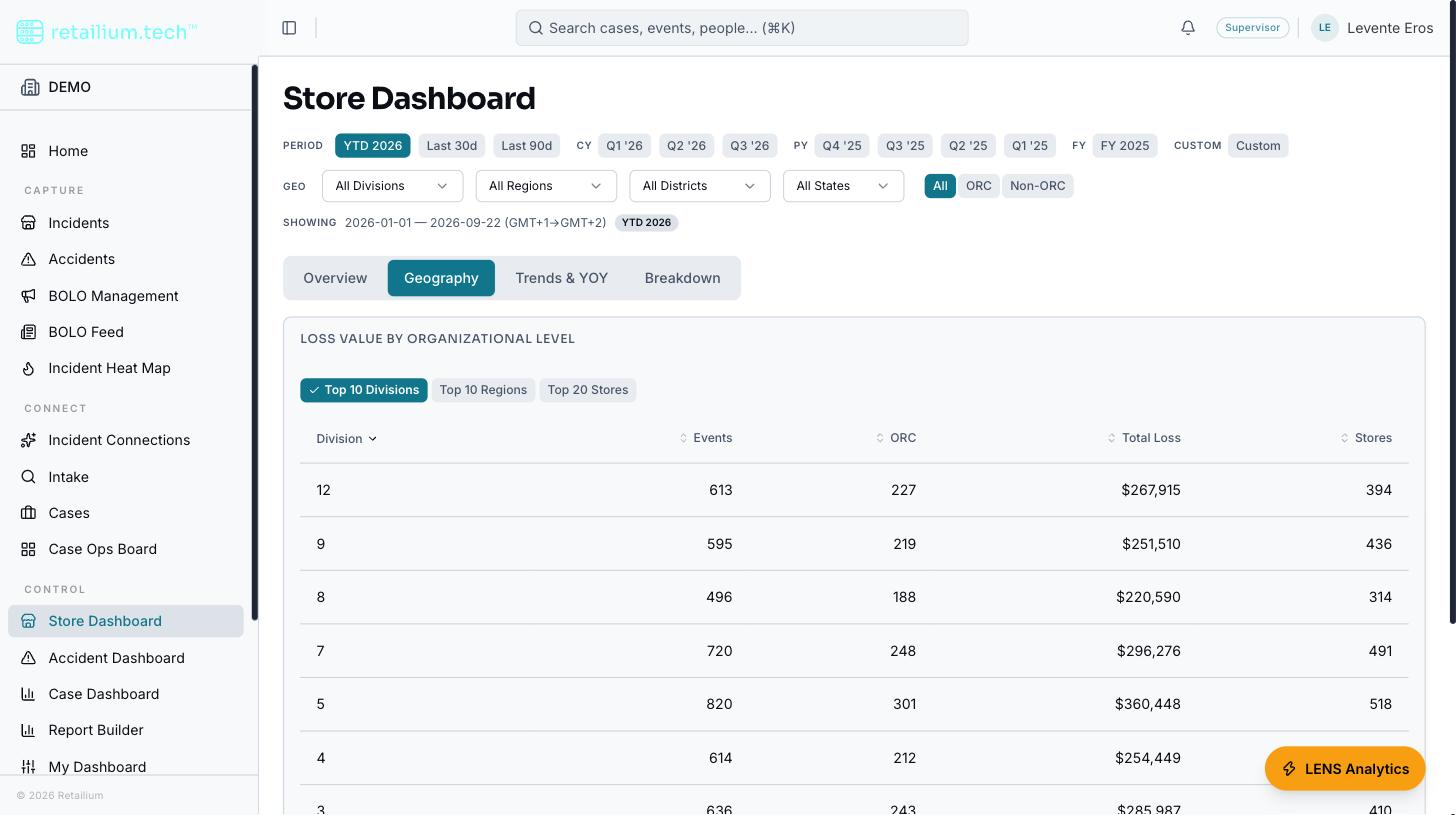
The Store Dashboard is a read-only analytical view of incident activity. Nothing on it creates, edits, or deletes a record. (It was previously called the Store Events Dashboard.)
Who can reach it
Administrators, Supervisors, Managers, ORC Analysts, Investigators, Store Coordinators, and the field asset-protection roles (Regional/District Asset Protection Managers) can open it. Regional and District managers have their geographic filters locked to their assigned territory and cannot widen beyond it. Auditors, Viewers, External Partners, and Store Associates cannot reach it.
Filters
The geographic filters cascade: choosing a division narrows the regions offered. There is no Reset control: clear a filter by putting it back to its "All" option, and the period by picking a different one.
| Filter | Choices | Default |
|---|---|---|
| Period | Year to date; last 30 days; last 90 days; each quarter of the current year; the four quarters of last year; the prior full year; or a custom range | Year to date |
| Division | All divisions, or one | All divisions |
| Region | All regions, or one | All regions |
| District | All districts, or one | All districts |
| State | All states, or one | All states |
| ORC related | All, ORC only, or Non-ORC only | All |
There is no market filter and no category filter on this dashboard.
KPI tiles
Five tiles head the page: Total Loss Value, ORC-Attributed Loss, ORC Event Count, Non-ORC Event Count, and Total Event Count. Each also shows the same figure for the prior year and the percentage change against it. None of the five is clickable: they are display-only. If the figures cannot load, the whole panel shows one message and one retry rather than tiles reading zero.
Charts
Charts sit under four tabs. The selected tab is carried in the page address, so a particular tab can be bookmarked or shared.
| Tab | Charts |
|---|---|
| Overview | The five KPI tiles, an ORC vs. Non-ORC event-count and loss split (with a supporting table), and stores with / without ORC events |
| Geography | Loss value by organizational level |
| Trends & YOY | Loss value trend; ORC event count by month; year-over-year loss value by quarter; year-over-year ORC event count by quarter |
| Breakdown | Loss by incident type; loss by product category (chart and table); loss by modus operandi; events by modus operandi |
Ask the Store Analytics Lens
The dashboard hosts a chat assistant, the Store Analytics Lens, that answers ad-hoc questions about incidents in plain English, with charts alongside the answer.
Typical questions: top stolen products at a store over a period, a comparison of two stores, a monthly trend for a division, an ORC breakdown, or which region has the most incidents. Any percentage, growth rate, or average is worked out with a calculator, not estimated.
Notes on how it behaves:
- It clarifies vague words. Ask something "interesting," "biggest," or "concerning" and it asks one short question offering concrete options rather than guessing.
- Territory applies automatically. For Regional and District managers, a store outside your territory is refused (the answer names the blocked store), and a question naming no store is answered within your territory.
- It picks a chart from the shape of the data: you can override by asking ("show as line," "pie chart").
Export an answer
Any answer in the conversation can be opened as a printable document: a print/PDF view carrying the answer's text and charts, headed with your organization's branding and the date and time it was produced in your own timezone. Any chart under an answer can also be copied to the clipboard as an image, to paste into a deck or email. There is no spreadsheet download and no way to save an answer back into the platform. (The same two exports exist on the Case Lens.)
Voice (dictation and read-aloud)
Voice is available on this Lens only. Tap the microphone, grant permission the first time, and speak; recording stops on its own after a short silence or after 60 seconds. With read-aloud off, the transcript is added to the input box for you to review before sending; with read-aloud on, it is sent immediately so the exchange stays hands-free. The spoken answer is a shortened rendering: the written answer on screen is always the complete one. No audio is ever stored.