
Case Dashboard
Summary: You will use the Case Dashboard to see case counts, values, outcomes, and trends, and optionally ask the Case Lens questions or request a written report.
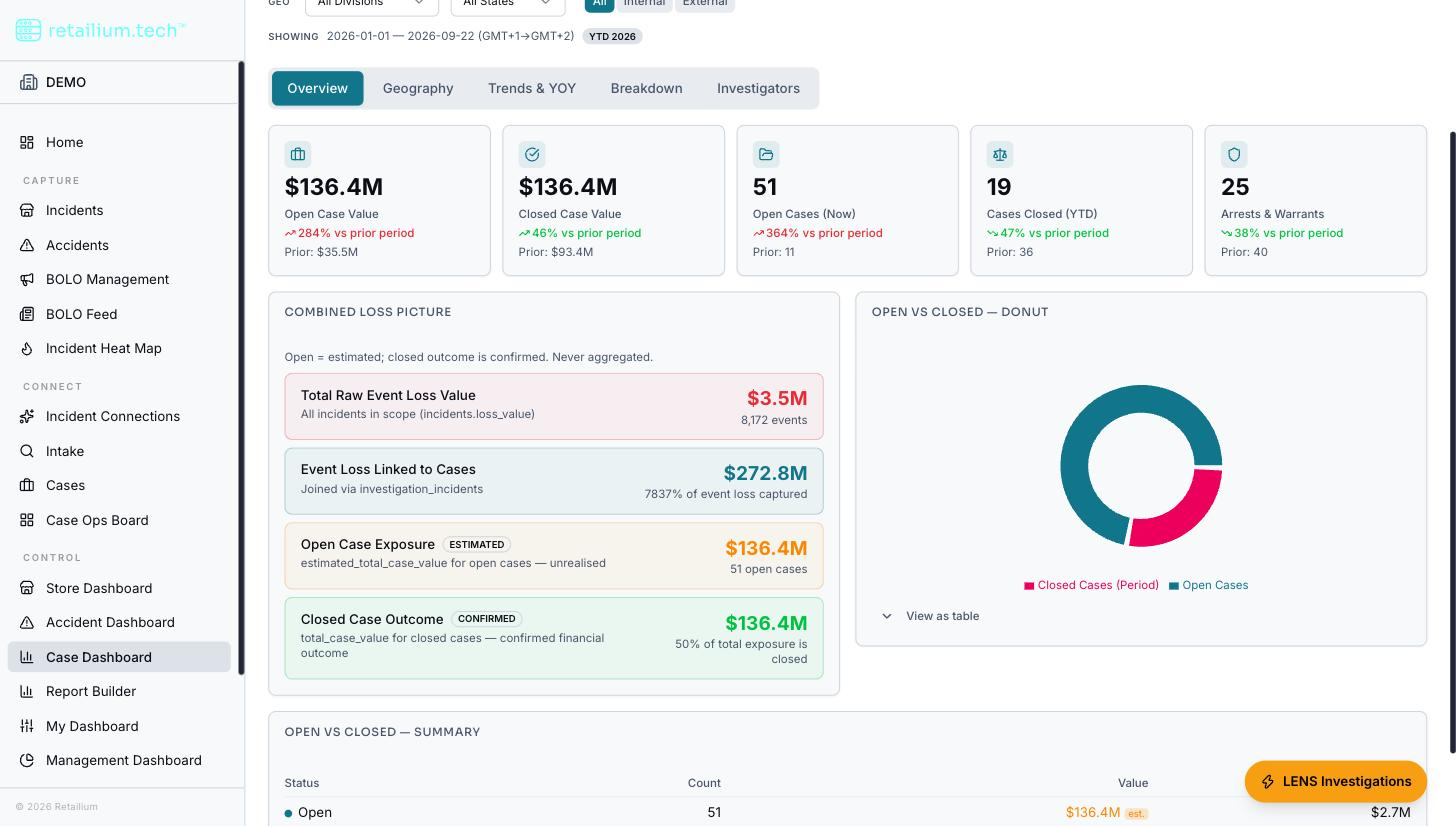
The Case Dashboard is a read-only view of case portfolio performance. It is a reporting-tier surface, for the roles accountable for a case portfolio. (It was previously called the Investigation Reporting Dashboard, and its assistant the Investigation Analytics Lens.)
Who can reach it
Platform Administrators, Administrators, Supervisors, Managers, and ORC Analysts reach it.
Investigators are deliberately excluded. An investigator works cases, and case reporting is a manager's surface. Investigators can still ask the Case Lens through chat, but they do not get this dashboard, the Management Dashboard, or Report Builder. This is the single most misread rule in the analytics area.
Every widget on this dashboard is scoped by the Chinese Wall: a walled user sees only the totals their own case access allows, not organization-wide figures.
Filters
Period (year to date, quarters, prior year, last 30 or 90 days), Division, State, and an Internal/External category toggle.
The category toggle only offers the categories your own labels imply. It is derived from the labels you hold, not from your role. If your labels resolve to a single category, you see a static badge instead of a toggle.
The tabs
| Tab | Content |
|---|---|
| Overview | KPI strip, combined loss picture, open/closed funnel |
| Geography | By-division table plus open and closed charts |
| Trends & YOY | Closed count and value this year against last, arrests and warrants, cases opened this year against last |
| Breakdown | By loss/violation type, by reported by, by lead, by product category |
| Team | Investigator performance |
Ask the Case Lens
The dashboard hosts a chat assistant that answers portfolio-level questions about cases, arrests, warrants, and trends, and, when asked, produces a full written report. It is text only (no voice).
It answers at portfolio level. It gives counts and values grouped or filtered across many cases, or a scoped list of cases as table rows. It never narrates one case's internal story (no entities, suspects, notes, or evidence), even when you name that case.
Typical questions: "How many open cases do I have this quarter?", "Which division has the most open cases?", "Team performance by lead", "List my 10 highest-value open cases", "How many arrests this quarter, by division?", and "Give me a quarterly report on External cases." Any percentage, growth rate, or average is worked out with a calculator, never estimated.
Chinese Wall scoping
Every figure respects your case access: Administrators and Supervisors get organization-wide totals; Managers get totals over cases carrying a label they hold; ORC Analysts and Investigators get totals only over cases they can access: no phrasing, including an organization-wide question, surfaces cases outside that set.
Question or written report
Every question is silently classified as either a direct answer or a full written report, based on how you phrase it: there is no mode switch. Asking for "a report," "a briefing," or "a summary document" produces a multi-section written report (Executive Summary, Breakdowns with at least one chart, Notable Cases, and Takeaways). Anything else gets a direct conversational answer with charts.
Export an answer
As on the Store Analytics Lens, any answer can be opened as a printable document (branded, timestamped in your timezone) and any chart can be copied to the clipboard as an image. A written report lives in the chat: it cannot be saved, scheduled, or downloaded as a file. To build and save reusable reports, use Report Builder.