
Incident Heat Map
Summary: You will use the Incident Heat Map to visualize where incidents cluster, choose what the shading measures, filter what is shown, and open individual incidents.
The Incident Heat Map shades a map so that brighter areas mean more incidents or higher loss, giving you a geographic picture of where crime is concentrating.
Who can reach it
Ten roles can open it: Platform Administrators, Administrators, Supervisors, Managers, ORC Analysts, Investigators, Store Coordinators, and the field asset-protection roles. Auditors, Viewers, External Partners, and Store Associates cannot.
Regional and District Asset Protection Managers may open it but it is deliberately left out of their navigation menu, so they reach it by direct link only. When they do, the map, tiles, and top-ten list are all bounded by their assigned territory.
Filters
| Filter | Default |
|---|---|
| Time range | Last 30 days (also 7, 60, 180 days, this year, last year, or a custom range) |
| Incident type | All types |
| Division | All divisions |
| ORC related | All events |
| Heat metric | Incident count (or loss value) |
| Show markers | Off |
Changing the incident type, division, ORC, or heat-metric filter re-shades the map instantly from data already loaded; changing the time range fetches a new set of incidents. Every filter is carried in the page address, so a shaded view can be bookmarked or shared.
The heat layer
Heat metric chooses what the shading measures. Incident count (the default) weights every incident the same, answering "where do incidents happen most often." Loss value weights each incident by its loss, answering "where is the money going": in this mode a zero-loss incident adds nothing to the shading, though it still counts in the tiles and top-ten list.
The color scale is relative to what the filters currently leave visible, not fixed. The top of the ramp stands for the 95th-percentile store in the current view, so one extreme store cannot flatten the rest. The legend always names the active metric and states the number the top of the ramp represents, and that number moves with the filters, so colors are comparable within one view but not between two different filter settings. Read the legend, not the color, when comparing periods.
The map matches your light/dark appearance setting, and the color scale adjusts to stay legible in each. Zooming out merges neighboring stores into broader areas (tuned to metro scale); zoom in and they break apart into individual stores.
Markers
Turn Show markers on to give each incident its own marker. The incident type is carried by both the marker's shape and its color (never color alone), so the type stays readable:
| Incident type | Shape | Color |
|---|---|---|
| Shoplifting | circle | red |
| Robbery | square | dark red |
| Assault | triangle | orange |
| Burglary | diamond | yellow |
| Fraud | pentagon | purple |
| Vandalism | star | cyan |
| Internal Theft | cross | pink |
| Other | hexagon | grey |
ORC-related incidents get a yellow ring. Select a marker to open a popup with the store number, incident type, date and time, loss value, city and state, and a View Event link that opens that incident in a new browser tab.
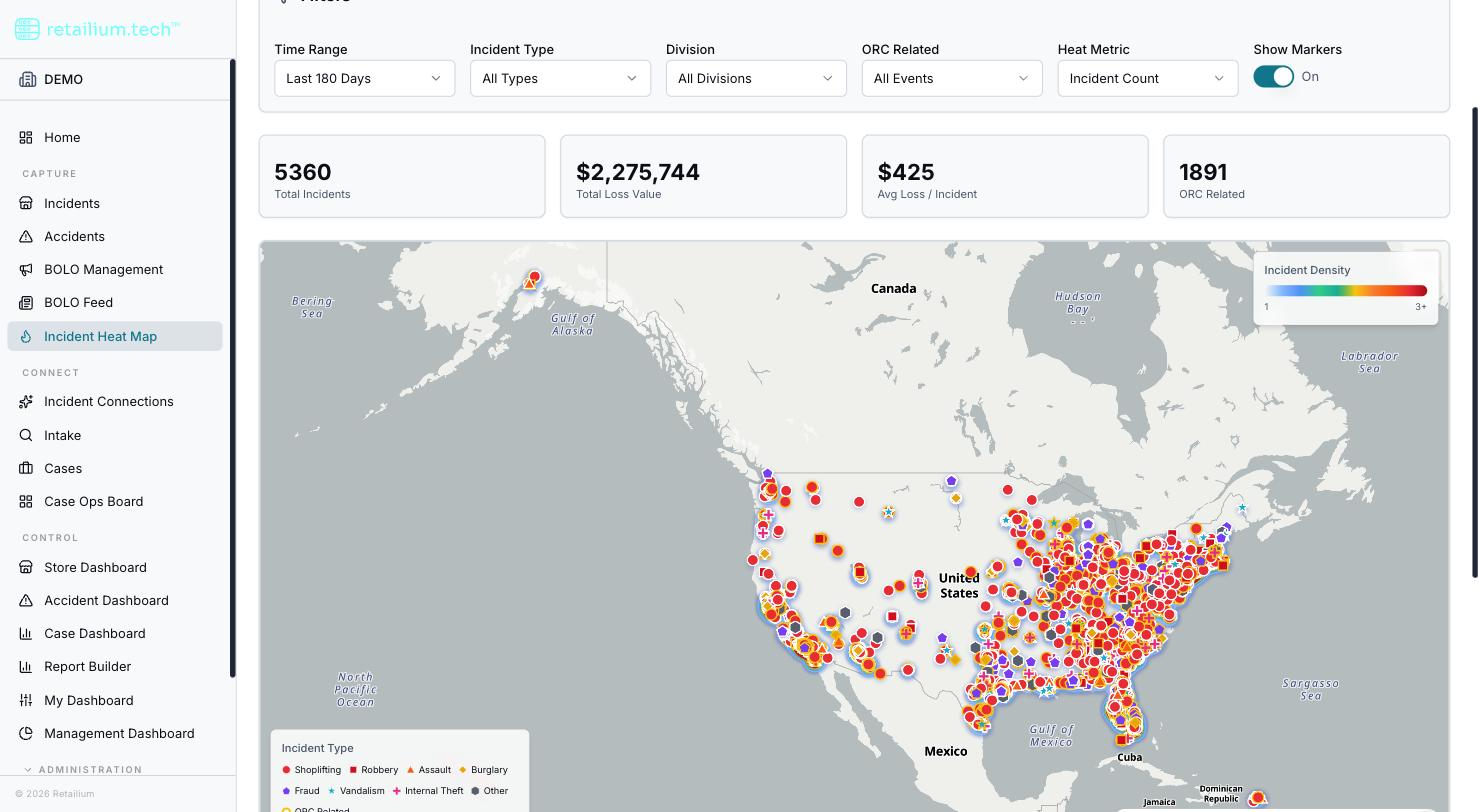
Summary figures
Four tiles are computed from whatever the current filters leave visible: total incidents, total loss value, average loss per incident, and the count of ORC-flagged incidents. Below the map, the ten stores with the most incidents in that filtered set are ranked, each with its city, state, and total loss.
Incidents at stores with no recorded coordinates are dropped before any figure is worked out: they appear neither on the map nor in the tiles nor the top-ten list. So everything on this page describes the same set of incidents: "incidents at stores we can place on a map." A busy store missing its coordinates is invisible here; the fix is to record the store's coordinates, not to read around the gap.
What the heat map does not do
There is no export from this page (no image, spreadsheet, or report) and no drill-down list of the filtered incidents beyond the per-marker popups and the top-ten stores.