
Report Builder
Summary: You will build a report by setting its controls or describing it to LENS, explore the underlying case rows, and save and share the report.
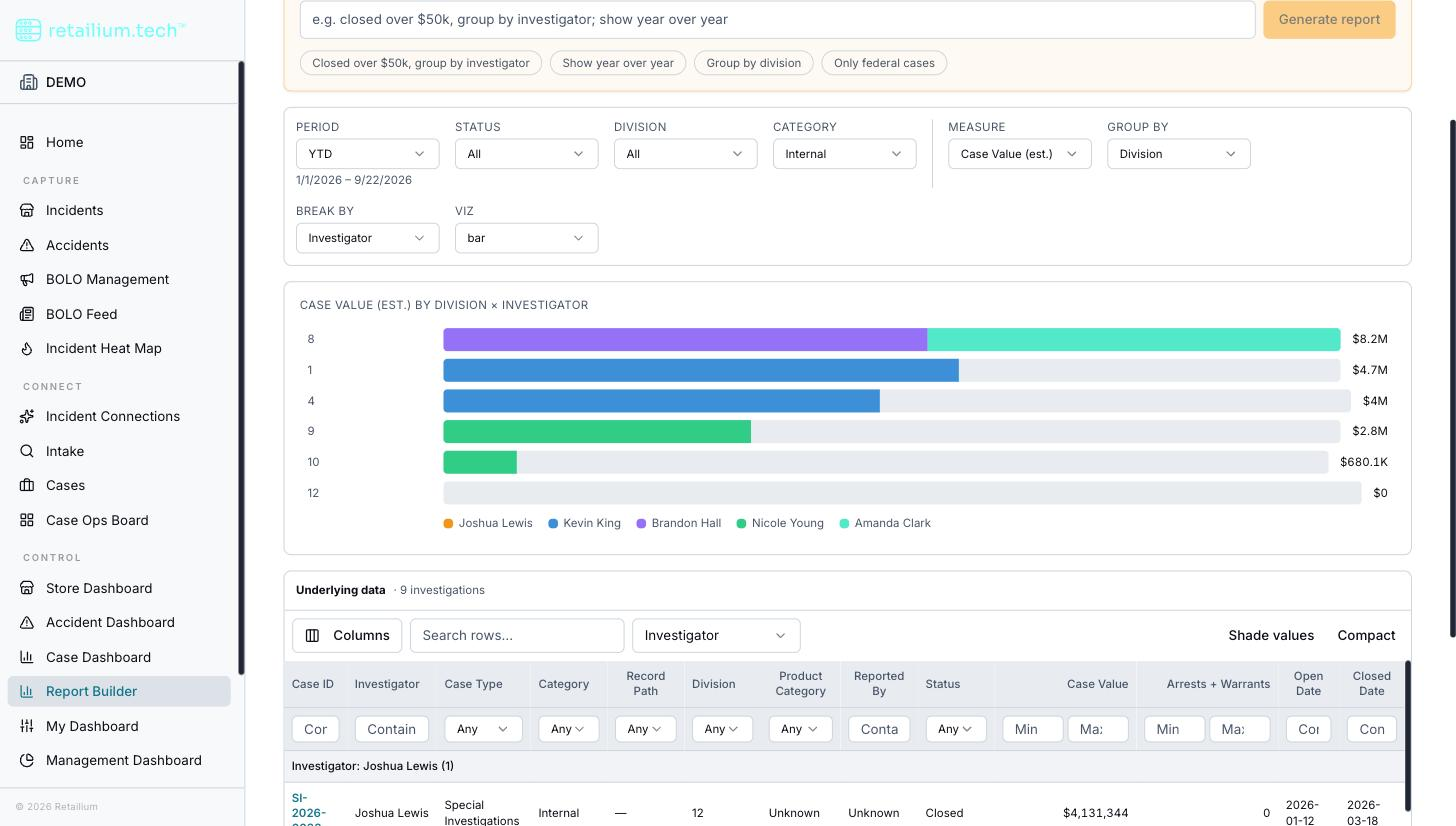
Report Builder is a self-service reporting surface for case (investigation) data. You pick a measure, a way to group and break it down, and a visualization, and get a server-computed report plus the case rows behind it: without waiting for a fixed dashboard widget to exist for that exact cut.
Who can reach it
Report Builder is visible to the same reporting tier as the Case Dashboard: Platform Administrators, Administrators, Supervisors, Managers, and ORC Analysts. Investigators do not get it: they are not in the reporting tier.
Every report runs under your own case access (the Chinese Wall): Administrators and Supervisors report organization-wide; Managers report over cases carrying a label they hold; ORC Analysts report only over cases they can access.
Define a report
A report is defined by five things, all editable on the page:
| Field | Options |
|---|---|
| Measure | Case Value (estimated, open cases) · Case Value (confirmed, closed cases) · Case Count · Arrests + Warrants |
| Group by | Investigator, Case Type, Category, Division, Product Category, Reported By, Initiated By, Status, Record Path |
| Break by | The same list, or None: an optional second dimension |
| Visualization | KPI, Bar, Matrix, Trend, YoY |
| Filters | Period, Status, Division, Category |
Visualizations in brief: KPI is a single number; Bar is one bar per group, optionally split by the break-by; Matrix is a crosstab heat-grid with exact values; Trend is a monthly line over the period (months with no activity show an explicit 0); YoY compares the current period against the same window one year prior.
The YoY indicator labels each row by what actually happened: a real increase is a green ▲, a real decrease a red ▼, no change a neutral ": 0%", growth from a zero prior year a green "New," and a drop to zero a ▼ 100%.
Period offers nine presets, including relative windows (Last 30 days, Last month, Last 3 months) that re-resolve every time you open the report. The toolbar always shows the resolved dates beside the Period control, so a relative or custom window is never ambiguous.
Clicking a bar segment or matrix cell slices the report: it adds that value as a filter and re-runs, rather than doing math in the browser.
Explore the underlying data
Beneath the chart is a full grid of the case rows behind whatever is on screen. Each row's Case ID is a link that opens that case in a new tab, so you can drill in without losing the report.
The grid gives you a column picker, a density toggle, an optional value-shading toggle, per-column filters, a row search, multi-column sort (shift-click to add a sort key), grouping, and a totals footer. The totals footer is computed across every row matching the filters, not just the (up to 200) rows displayed, so it stays accurate even when a group subtotal only covers the rows on screen.
Every grid setting (filters, search, sort, visible columns, order, density, shading, grouping), is part of the report definition and saves with it, so reopening a saved report restores the exact grid its owner left.
Build or refine by describing it
Rather than touching the controls, you can describe the report in plain English in the command bar at the top: for example, "closed case value by division this year, split by internal vs external." LENS interprets the request, builds the report, and loads it into the editable view with the controls already set.
The same bar refines an already-open report: "group by division," "show year over year," or "closed over $50k, group by investigator" all edit the current report rather than starting a new one. You never have to know whether your request is a "chart" change or a "grid" change: LENS decides what to move.
Save, share, and favorite
- Save turns the current report into a named row at a stable URL. It starts private: visible only to you.
- Flip the Shared toggle to make it visible to every Report Builder user in your organization. Only the owner can edit, rename, delete, or un-share it; a shared report is read-only to everyone else.
- Save as copy creates a new private report you own, seeded from any report you can see: including one someone shared. This is how a non-owner turns a shared report into something they can edit.
- Favorites are personal. Star any report visible to you. Un-starring is how a non-owner removes a shared report from their own view.
Sharing needs no manager approval, because a saved report is a definition, never the case rows behind it: opening any report re-runs the computation under the opener's own access, so a shared report can never hand a walled user another team's rows.
The catalogue
Report Builder's landing page is a catalogue of saved reports, with Favorites and Catalogue tabs. Each row shows the name, a one-line description, the visualization type, the owner, when it was last run, and whether it is yours or shared. Search and owner/type filters narrow the list. Selecting a row opens that report.
Good to know
- There is no export today. Report Builder will plug into the platform's full export system when that lands.
- No "solutions used" (technology attribution). Attributing recovered value to specific loss-prevention technologies has no backing field in the data model yet. If you ask LENS for this, it says so plainly and offers the closest available substitute (grouping by Case Type), rather than inventing a dimension.
- Report Builder covers case data only. Incident-level reporting belongs to the Store Dashboard and its Lens.